To stay ahead of the competition in today’s market, it is more important than ever for SaaS companies to not only attract and retain their target customers, but also to monetize those customers in a way that increases ROI and promotes longevity.
While HubSpot has a wealth of tools that can help SaaS companies accomplish all of the above, it’s easy to get lost in the weeds and unknowingly waste precious time and resources on tracking the wrong metrics.
In this blog post, we outline the best metrics for your SaaS company, how to choose and track them using HubSpot, and how to glean the information you need to execute a plan of action.
Key SaaS Metrics to Track
- Monthly Recurring Revenue (MRR)
- Product Usage
- Free-Trial-to-Paid-Customer Ratio
- Demo-to-Paid-Customer Ratio
- Customer Health Score
- Customer Churn Rate
- Revenue Churn
- Customer Lifetime Value (CLV)
- Customer Acquisition Cost (CAC)
- Attribution Reports
How to Select the Key SaaS Metrics You Should Track
First, your company must be clear on target outcomes and which metrics will need to be tracked based on those goals. While it’s beneficial to keep an eye on metrics like unique visitors to your website, marketing qualified leads, and sales qualified leads, these values are meaningless unless they’re directly tied to a target outcome or call to action.
HubSpot’s vast range of data collection can be overwhelming, so remember to start small. Choose the metrics you deem most important based on your SaaS company’s unique target outcomes and build from there. A well-rounded strategy will marry marketing metrics with sales and service metrics, and HubSpot provides plenty of ways to do just that.
Most importantly, make sure you spend the time to create actionable steps based on the data you collect. Ask yourself: What steps can I take once I know this information? If you don’t have the resources or time to take actionable steps based on the metric data, do not invest in finding answers to that metric just yet.
The last thing you want to do is make drastic adjustments or investments to collect data for a metric that you later discover you didn’t need to track in the first place.
[CHART] The Key SaaS Metrics Your B2B SaaS Company Might Focus On
|
Key SaaS Metric |
Why it Matters |
How to Calculate |
|
Monthly Recurring Revenue |
Sets a baseline for the number of customers you need to retain/attract each month to remain profitable |
The average revenue per account x the total number of accounts that month = MRR |
|
Product Usage |
Alerts companies to a potential precursor to churn |
The app usage during existing month - usage during previous month = Change in product usage |
|
Free trial to paid customer ratio |
Shows the effectiveness of a free trial in converting customers; exposes pain points |
Number of free trial signups that led to a paid customer ÷ Total number of free trial signups during a particular timeframe = Free trial to paid customer ratio |
|
Demo to paid customer ratio |
Shows the effectiveness of a demo in converting customers; exposes pain points |
Number of demo sessions that led to a paid customer ÷ Total demo participation during a particular timeframe = Demo to paid customer ratio |
|
Customer Health Score |
Similar to lead scoring but for customers. CHS is a scoring model applied to customers to track engagement, happiness, likeness to churn, etc. |
Assign values based on important indicators like app usage, service tickets, etc. to take action when a Customer’s Health Score drops |
|
Customer Churn Rate |
The number of customers your business lost within a given time period; provides information about why your customers discontinued your service |
Number of lost customers within a certain timeframe divided by the total number of customers you had at the beginning of your timeframe = Customer Churn Rate |
|
Revenue churn |
The amount of revenue your business lost within a given time period due to customer churn |
Divide the total revenue lost during a certain time period (usually monthly) by the total revenue you had at the start of that timeframe = Revenue Churn |
|
Customer Lifetime Value |
The average amount of revenue a customer generates during their entire relationship with your company |
Average annual spend X average length of customer = Customer Lifetime Value |
|
Customer Acquisition Cost |
The amount it costs to acquire a new customer |
Total sales and marketing spend ÷ number of new customers = Customer Acquisition Cost |
|
Attribution Reporting |
Assigning revenue or assisted contact value to elements of your digital marketing or sales assets such as channels, content pieces, site pages, and sales emails. |
Attribution report setup varies, see this resource for more information. |
Key SaaS Metrics and How to Track Them in HubSpot
1. Monthly Recurring Revenue (MRR)
Monthly Recurring Revenue (MRR) Definition
The amount of revenue you generate for a given month. MRR provides businesses with a reliable benchmark metric to set growth goals. MRR shows you how much you can spend while remaining profitable which is especially important for subscription-based SaaS models.
How to calculate MRR: Calculate your monthly recurring revenue by multiplying the average revenue per account by the total number of counts in a given month.
MRR can be calculated for subsets of your customer base, such as new customers or churned customers, in order to adjust strategy or projections.
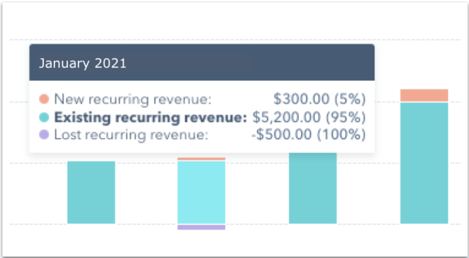
How to Track Monthly Recurring Revenue in HubSpot: Tracking MRR is easiest when you’re using HubSpot CRM and Sales. Here is a really awesome guide from HubSpot that outlines how to track MRR. HubSpot’s Revenue Analytics tools enable you to set and customize key data by pipeline for:
- Your recurring time range (do you bill monthly, quarterly, or yearly?)
- New recurring revenue
- Existing recurring revenue
- Churned/lost monthly revenue (more on that below)
2. Product Usage
Product Usage Definition
Product Usage is a quantifiable metric for the amount of engagement customers have with your software. These can include number of logins, the amount of time they spend using the app, the amount of features or add-ons they use, the amount of users that are active, and more.
You already know it’s more cost-efficient to retain existing customers than to acquire new ones, so it’s important to find out when a customer is at risk for churn and intervene at the appropriate time. If a customer’s usage has declined drastically - for example, 50% in one month - it might be too late for you to take action to save them.
Product usage might look different from company to company depending on the type of software and target outcomes.
How to Track Product Usage in HubSpot: Your app metrics need to speak to HubSpot via an API or regular manual data import. A savvy HubSpot Partner may be able to help you build that.
Then, create custom properties in HubSpot to align with the app usage data you want to track. Once you have your data speaking to HubSpot, it’s easy to create segmentation criteria so you can:
- Set up monitoring reports on a targeted usage dashboard
- Set up alerts or internal notifications when a customer’s usage drops below a certain threshold so your customer service team can take action
- Track usage averages and other key usage metrics over time
3. Free-Trial-to-Paid-Customer Ratio
Free-Trial-to-Paid Customer Definition
The ratio of potential customers who sign up for a free trial and ultimately convert to paid customers.
SaaS companies that acquire customers through free trials must understand exactly how beneficial the free trial is in converting them to customers, and where potential customers might be falling off.
For example, your company might have a high volume of free trial signups, but what if those who complete their free trial never go on to become a paid customer?
Pay attention to the following metrics and track them by enabling your software to communicate with HubSpot:
- Trials engaged, which is the number of potential customers who request and then begin the trial, versus trials abandoned, which is the number of potential customers who request a trial and subsequently abandon it. Find out which factors are preventing potential customers from completing the trial and act accordingly.
- Trial to paid. You’re already measuring your lead-to-customer rate, but how does this rate change when looking strictly at leads who have engaged in a free trial? Analyzing the time period from when customers begin their free trial to when they become paying customers can provide plenty of insights on what can be done during the optimum window of time to ensure conversions.
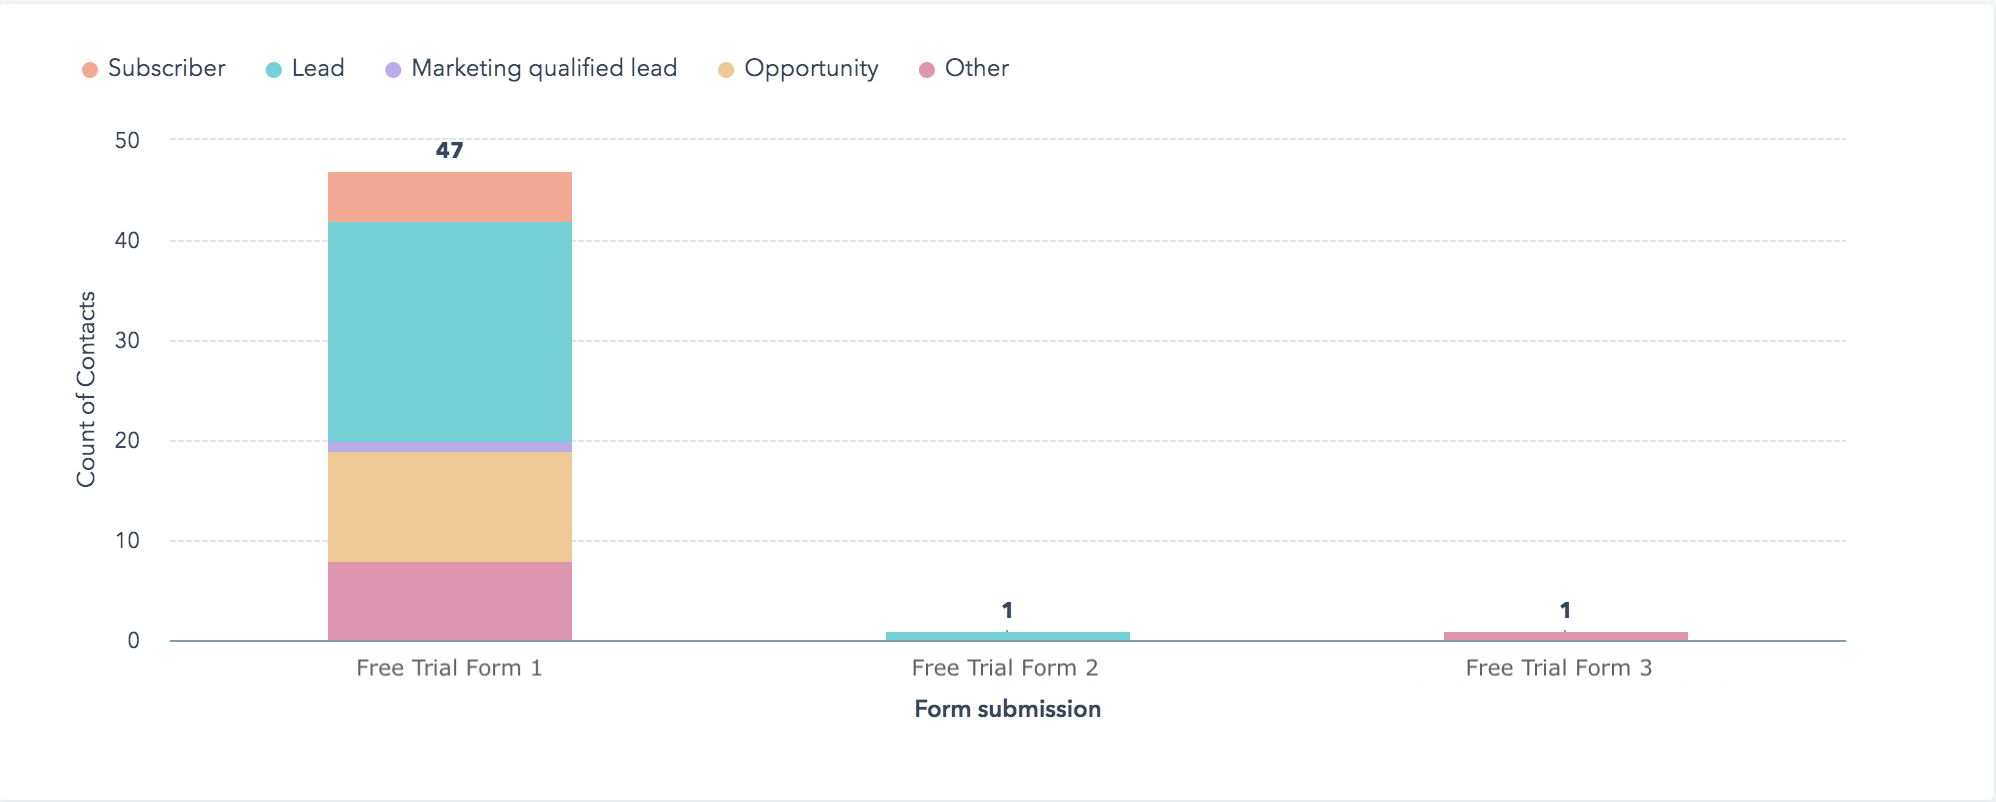
How to Track Free-Trial-to-Paid-Customer Ratio in HubSpot: There are a few ways you can manage your trial engagement metrics with HubSpot. Here’s a great place to get started:
- Have a dedicated free trial form: This will allow you to track trials engaged. In most cases, it's safe to assume that anyone who fills out a free trial request form has engaged with a trial.
- Sync your trial usage metrics to HubSpot: Do this via an API, manual data entry by a sales rep, or regular imports. Create custom properties for users who abandon their trials. These contacts are prime for further nurturing from sales or marketing. Try to determine why they abandoned their trial and address that head-on in your marketing. Do they need more hand-holding? Do you need a trial-centric knowledge base to answer FAQs? Are you showcasing the value of your product or service with how-to videos and success stories?
- Create a list or report of trial form submissions by lifecycle stage: Add this as a list or as a dashboard report to show your trial-to-paid ratio. Have visibility into where your contacts are in your funnel based on their trial request.
4. Demo-to-Paid-Customer Ratio
Demo-to-Paid-Customer Ratio Definition
The ratio of potential customers who participate in a product demo and then ultimately convert to paid customers.
Similar to the Free-Trial-to-Paid-Customer ratio, this metric shows the effectiveness of a product demo in converting customers, as well as any pain points in your process that may divert potential customers.
There are two things to consider when examining the demo to paid customer timeline:
- Length of time from requesting a demo to converting to a customer: If there is a large gap between users who are requesting a demo and converting to customers, dig into why that may be the case. Did those users feel they were lacking the information needed to move forward?
To help assess, you may want to consider interviewing your existing customers. Do your customers recall what information would have been helpful pre-purchase? What were the most pressing questions they needed answers to before buying? Use these insights to help identify key factors that you can correct for your prospects. For example, maybe you need to make pricing more transparent. Or perhaps a round-up of helpful FAQs would help alleviate particular buying concerns. Such insights will also better position your sales reps to be at the ready to serve as helpful advisors. - Type of demo: Segmenting your demonstrations by type and comparing them to how many customers closed is extremely valuable. For example, if an on-demand video demo leads to 2x as many customers, then it’s time to invest more in video demos. If your video demo is gated, but it closes 2x as many customers, consider un-gating it to remove friction from your buyer’s research process.
How to Track Demo-to-Paid-Customer Ratio in HubSpot: Tracking demo information in HubSpot gives your marketing and sales team critical metrics on demo performance over time. Here’s how:
- Have a dedicated demo form for each demo type. For example, have one demo form that offers live demos from your sales team, and have a separate demo form for on-demand video demos. This allows you to segment by demo type based on the form submitted.
- Compare form submissions to lifecycle stage = customer. In a given time period, this will allow you to see how many demos led to paid customers, and segment by demo type.
Note: If your demo video is NOT gated, there are other means to track this metric, such as CTA clicks, page views, and so on. - Time-stamp any contact who submits a demo request form. Create a custom date property in HubSpot called “request a demo date.” Then, automate a timestamp to this property every time a demo request form is submitted. This lets you track the exact moment someone requests a demo; data that is extremely valuable in understanding how long it takes someone to become a customer after requesting a demo.
5. Customer Health Score (CHS)
Customer Health Score Definition
CHS attributes a score value to how often a customer uses your software and how much they rely upon it. Think of it as “lead scoring” for your customers.
While the customer health score is typically used as a customer success and service-oriented metric rather than a marketing or sales metric, it is critical to building your customer base and can bolster marketing efforts.
Many SaaS companies also rely on a Net Promoter Score (NPS) score which is an index that measures the likelihood of your customers to recommend your product or service to others on a scale of 1-10.
How to Track Customer Health Score in HubSpot: Your customer health score can be easily calculated when you use a service or ticketing app like HubSpot Service Hub. To calculate your Customer Health Score, consider flagging customers that open a lot of service request tickets for a personalized reach-out.
You might also consider categorizing ticket types to indicate whether a customer is at risk for churning. For example, if a customer calls or emails in asking about discounts, overall value, or a competitor, flag that ticket for follow-up.
HubSpot’s Customer Feedback tool is a great place to get started in collecting tangible feedback from your customers.
6. Customer Churn Rate
Customer Churn Rate Definition
Customer Churn Rate (or simply, Churn Rate) is the number of customers your company loses in a given time period. Churn Rate is not only important to track, but it also offers you the ability to research important information about why your customers discontinued your service.
Churn Rate is a metric that everyone in the company should care about. Marketing, sales, and service departments should assess the data from churned customers for noteworthy insights among particular audience subsets, and pay attention to any anecdotal information as well.
Listen to your churned customers. Ask them to share why they are leaving. Track these reasons in a custom “Churn Reason” multi-select field. Then, prioritize a solution for your most prominent churn issues -- fast.
In the SaaS world, competitors are always ready to sweep away your customers. Make sure you listen and adapt to your customers' needs before that happens!
How to Track Customer Churn Rate in HubSpot: Since there is no default HubSpot lifecycle stage for “canceled” or “ex-customer,” you have a few options for viewing and segmenting churned customers in HubSpot. If HubSpot isn’t your primary CRM, you will have to make sure information about cancelations syncs to HubSpot. You can do that in two ways:
- Create a custom property to mark canceled customers (recommended). Even though the lifecycle stage will remain “customer,” you can create a custom contact property that indicates when someone has canceled a subscription. This will allow you to segment your customer group by "canceled" and use it as a property in dashboard reporting. Once segmented, you can retarget or re-market to this group.
- Use the lifecycle stage “other.” Using the lifecycle stage of “other” can allow you to segment customers who cancel. You will have to set up an automation to trigger the move to “other” when a customer cancels, or manually make the switch. In general, try to keep the lifecycle stage assigned as “Customer” and use a custom property so you can see your overall customer reports in aggregate.
7. Revenue Churn
Revenue Churn Definition
The amount of revenue lost in a given time period due to customer churn. You can also experience revenue churn due to customer downgrades.
Revenue Churn and Churn Rate go hand-in-hand for company-wide importance. Revenue churn is an especially important metric for SaaS companies that rely on Monthly Recurring Revenue (MRR).
Let’s say your software has three service levels with matching MRR costs: low, medium, and high. If you notice customers in the mid-range MRR bucket are churning, or downgrading, faster than the others, this is an opportunity for you to address this revenue loss head-on.
How to Calculate Revenue Churn: Calculate revenue churn by assigning a dollar value to each of your customers, and adjust this dollar value accordingly per the subscription price and plan.
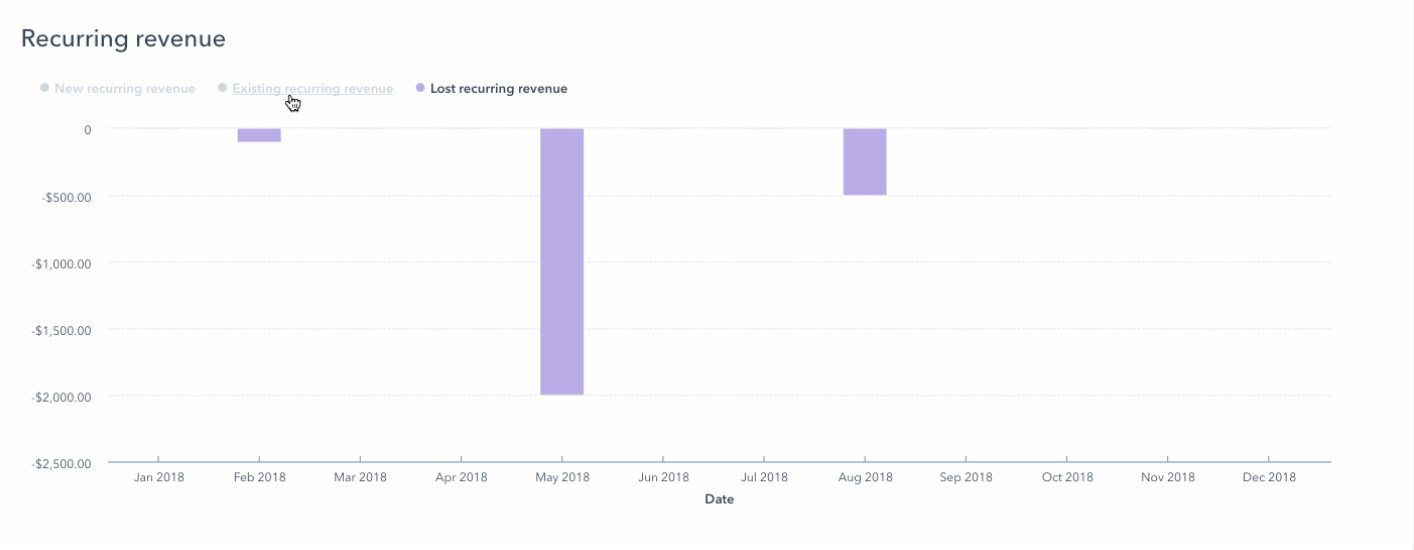
How to Track Revenue Churn Rate in HubSpot - Tracking revenue churn is easiest to do if you use HubSpot CRM and Sales. HubSpot has the ability to track Revenue Analytics for SaaS companies that rely on monthly recurring revenue. Here is an article from HubSpot that outlines how to record recurring revenue and indicate when revenue has churned. If you’re already using Revenue Analytics, you would follow these steps to indicate churned revenue:
- In the recurring revenue inactive date property, select the date.
- In the recurring revenue inactive reason property, select "churned."
- Click Save.
You can then view your recurring and lost revenue using Revenue Analytics reporting:
8. Customer Lifetime Value (CLV):
Customer Lifetime Value Definition
The average amount of revenue a customer generates during his or her entire relationship with your company. CLV helps SaaS companies project their growth and communicate value to stakeholders.
For SaaS companies, CLV can also open the door to possibilities for providing new services or add-ons that extend customer retention.
Tips for increasing Customer Lifetime Value
- Increase the number of times customers use your product. In the SaaS world, this is known as “stickiness” or “how sticky” your customers are. In other words: how likely are they to stay with your product or service? The best way to improve customer stickiness will look different for each SaaS company, but some common ways to help customers stay longer include optimizing factors like product adoption, perceived value, pricing, transparency over product growth, or implementing a dedicated account manager and/or customer service teams.
- Increase the amount of money customers spend with you. Whether it’s awesome new add-ons, streamlined channels to upgrade, or awesome referral incentives, strategize the best ways to give your customers more value (that they’re willing to pay for).
How to Track Customer Lifetime Value in HubSpot: While you probably wouldn’t store CLV metrics in HubSpot, there are some HubSpot metrics that can help you determine CLV.
According to HubSpot, you’ll need to gather:
- The average purchase value for your customers
- The purchase rate (how often they buy in a time period)
- The average customer value (average value x purchase rate)
- Your customer lifespan (how many years they stay with you -- and if you're unsure, try dividing “1” by your churn rate)
- Calculate CLV by multiplying average customer value by customer lifespan
For more on calculating CLV and to use a free CLV calculator, check out this article.
9. Customer Acquisition Cost (CAC)
Customer Acquisition Cost Definition
The amount of money a business spends to acquire a new customer. This is a critical metric to determine overall profitability. Customer Acquisition Cost is most commonly calculated by dividing the total cost of marketing dollars spent in a given time period by the number of customers generated in that same time period.
In short, CAC shows you how many marketing dollars are spent to generate new customers.
More advanced CAC models may also factor in:
- Sales costs
- Employee costs
- Other spend (such as publication subscriptions, publishing costs, and more)
- Engineering and maintenance costs - how much it costs to actually develop and maintain your SaaS product
CAC can also be divided into subsets of marketing investments. For example, you can calculate the CAC of your paid strategies by dividing your paid budget by the number of customers generated from paid ads in a given time period.
CAC is critical to track against your Customer Lifetime Value (CLV). Generally speaking, you will not want your CAC to be higher than your CLV. When measured against CLV, you can determine how much value customers provide against the cost of attracting them in the first place, as well as how long it will take to make up for CAC and derive profit from a customer.
Important Note: While CAC is a critical SaaS metric, be wary. Let’s say you make a big investment in evergreen marketing efforts in Q3 2020. You may not see organic results from those efforts until Q1 2021 -- that can dramatically skew your CAC metrics for 2020. So while it’s important to have a pulse on your CAC, keep your long-game in mind. Sometimes you have to spend more to make more down the line.
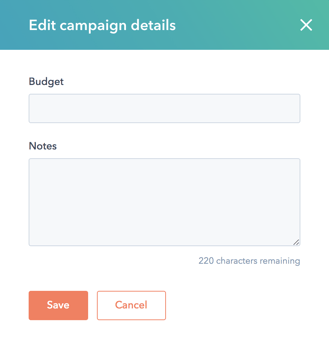
How to Track CAC in HubSpot: Depending on how advanced you want your CAC model to be, tracking in HubSpot is likely not the best place. The HubSpot Campaigns tool has some features which allow you to assign a very basic budget. But in general, we find the SaaS companies we work with to be looking at more advanced data that spans employee costs, ad spend, content development costs, and more. You’re simply not able to track that in any meaningful way in HubSpot at this time.
10. Attribution Reporting
Attribution Report Defintion
An attribution report is a common dashboard report that attributes customer-engagement and dollar-value to specific marketing channels, content pieces, actions, and more. An attribution report enables you to see which elements of your marketing are the most impactful to closing customers and driving new revenue.
SaaS companies often overlook attribution reporting in favor of other metrics. However, when developing a long-term marketing strategy, ensuring you have an understanding of what’s working - and what’s not working - today can make all the difference six months from now.
For example, if social media is responsible for generating 3x as many customers as your email marketing efforts, it may be an indicator that:
- You should be investing more in social media. If your budget or resources or limited, focus on the areas that drive the most value for your customers and business
- You should review your email marketing efforts. If you have the budget and the resources, it may be time to refresh your lead generation or nurture emails to perform alongside your best marketing content.
How to Build Attribution Reports in HubSpot: The Reporting Add-On feature of HubSpot gives you out-of-the-box attribution reporting for content, sources, and revenue. However, if you want to accurately track revenue in HubSpot, you’ll need to be using HubSpot CRM or syncing your CRM data to HubSpot deals. In SaaS especially, you’ll need to be sure your recurring revenue systems are setup to track as well so the revenue generated over time is considered in your attribution report.
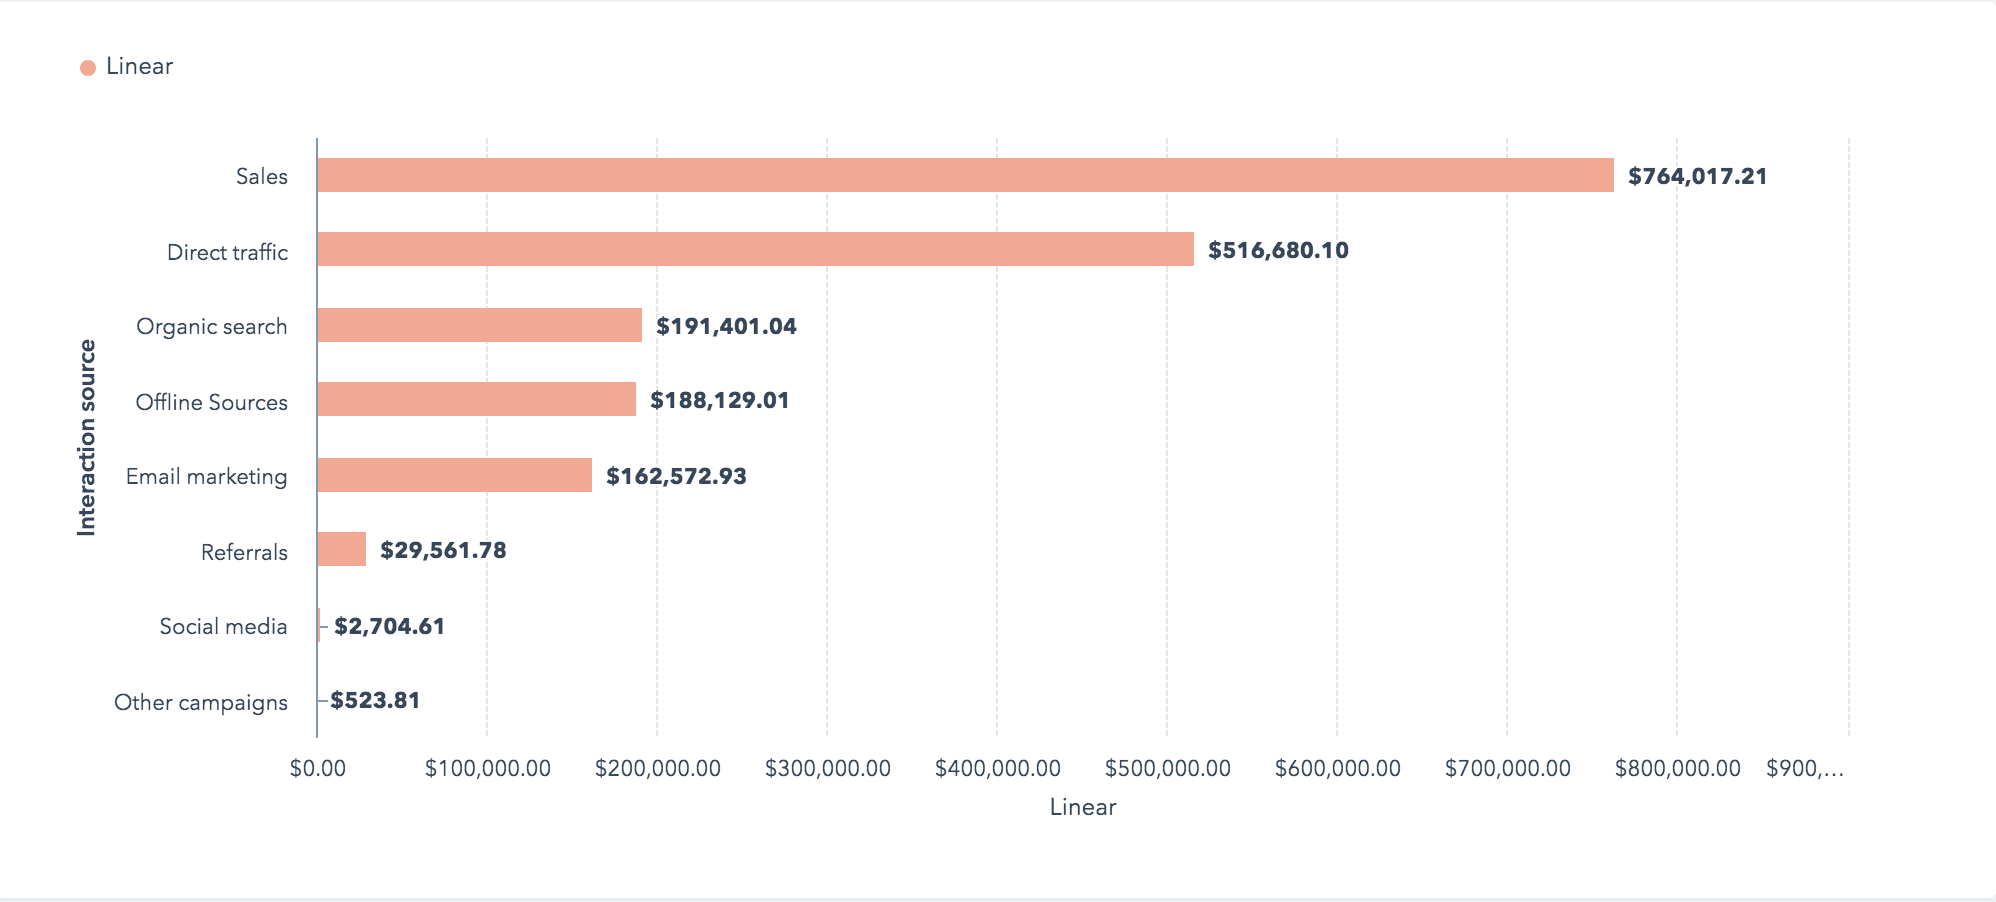
Here is an example report showing linear attribution to source type in HubSpot:
Other Key SaaS Metrics to Track
Of course, like any company that invests in digital marketing, you will also want to have tools in place that help you track key marketing insights like:
- Organic and other website traffic trends
- View-to-Contact Conversion Rate by Channel (which marketing channels create the most new leads for you?)
- Contact-to-Customer Conversion Rate by Channel (which marketing channels create the most new customers for you?)
- Email Engagement Metrics (like opens, clicks, and unsubscribes)
- Social Engagement Metrics (like reach, likes, and subscribers)
- And more --
An Important Note on Tracking Key SaaS Metrics
If you type “Key SaaS Metrics” into Google you’re going to see hundreds of blog posts with complex charts, insane metrics, and of course, key industry stakeholders waving their arms about important data you need to track TODAY.
We’ve been working with SaaS companies for 18 years and have found that most companies simply don’t have the infrastructure or ability to generate most key SaaS metrics.
That can feel pretty overwhelming.
We always recommend starting small and focusing on the metrics that you can address right away.
For example, don’t spend too much time figuring out your demo-to-close rate if your company can’t invest in alternative demo strategies (like on-demand videos or interactive content). In other words: don’t invest an enormous amount of time and effort in finding answers to problems you can’t solve just yet -- otherwise you’re wasting valuable time and resources -- and discouraging your growth.
Now, that’s not to say these metrics aren’t important and should be dismissed -- if you’re spending more on customer acquisition than they’re worth quarter after quarter -- that’s a big problem. We know that SaaS companies move fast. Most of the SaaS owners we talk to wear many hats and already know there are data and metric gaps. That’s why focusing on what you can do and taking action is almost always better than focusing on what you can’t. Instead, identify gaps can help you see where you need to invest time and resources in the future.
Remember that tracking key SaaS metrics is not a “one and done” investment. To continue expanding your SaaS company, you must constantly evaluate your data and determine your level of growth.
Want to learn more about setting and collecting target SaaS metrics through HubSpot? We hope you’ll contact us and connect with one of our certified HubSpot trainers.


